
Can It Chart?
A link to my application can be found here. Type in both the song and its corresponding artist and see how it fares in terms of the Billboard Hot-100. The graph in the center is an index of how each song’s audio feature compares to the average Billboard song’s audio features. To see how the artist is rated as a whole, click the “artist page” section.
Overview
In the music industry, A&R divisions have traditionally been responsible for talent scouting through methods like “gut feeling” and relying on “tastemakers” in the industry. This can be an issue for new artists looking to make a name for themselves but may not be necessarily be well connected. With artists increasing using social media channels and the barrier of entry to create music getting lower and lower, A&R divisions may be stymied in the decision making process.
But what if we tried to automate the process of finding new talent? As a preliminary search tool, can we find songs and artists that have potential to be the next big thing?
I built an application called “Can it Chart?”, which uses song features from Spotify to predict whether a song has the ability to appear on the BillBoard Hot 100.
Methodology
For my target variable, I wanted to see whether a song is on the Billboard Hot 100 charts. The Hot 100 chart is an industry standard record chart in United States for songs, and is predominantly based on sales, radio play, and online streaming. From a business perspective, if you can find an artist that has the potential to be on the Billbaord Hot 100, you can ultimately increase the profitability of your label.
This project was a binary classification problem with the following labels:
- Class 0 - “Will not chart”
- Class 1 - “Will chart”
I optimized heavily towards Class 1 recall with the intention of not missing out on the “next big thing”. However, finding songs that are falsely classified is okay, as these songs might be considered “honorable mentions” for a later evaluation.
Obtaining Data
From SongFacts.com, I used BeautifulSoup, a web scraping library, to obtain a list of songs released from 1/1/10 to 5/6/18. I then took all Billboard Hot 100 songs from the same time period added them to the SongFacts.com list. From there, I leveraged the Spotify API to pull audio features as well as artist genres for the songset.
At the end of the day, I had an imbalanced class set of Class 0:Class 1 = 4:1.
Model Training
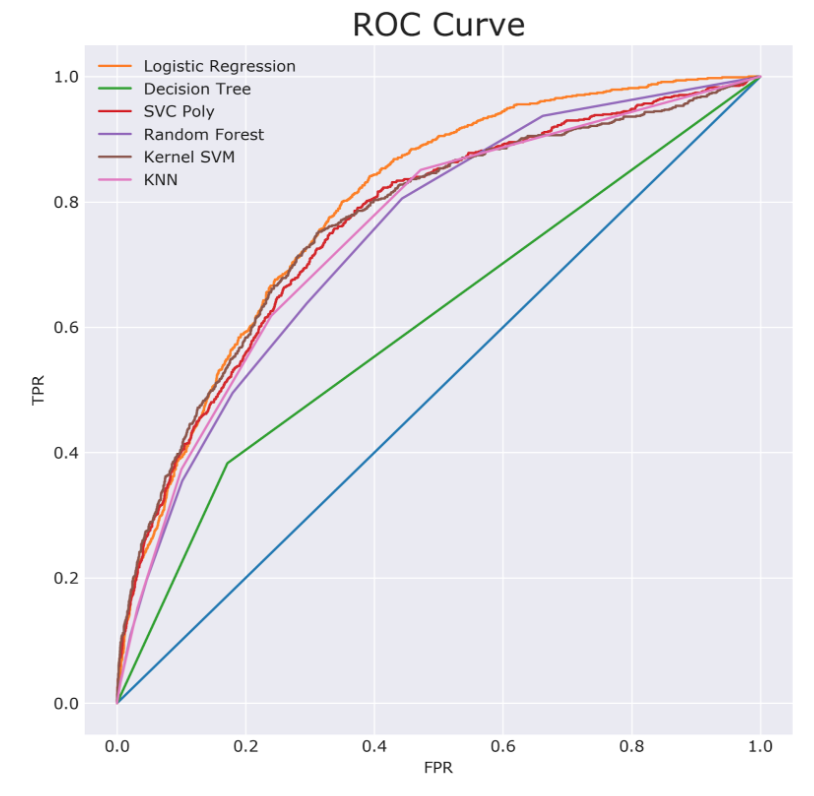
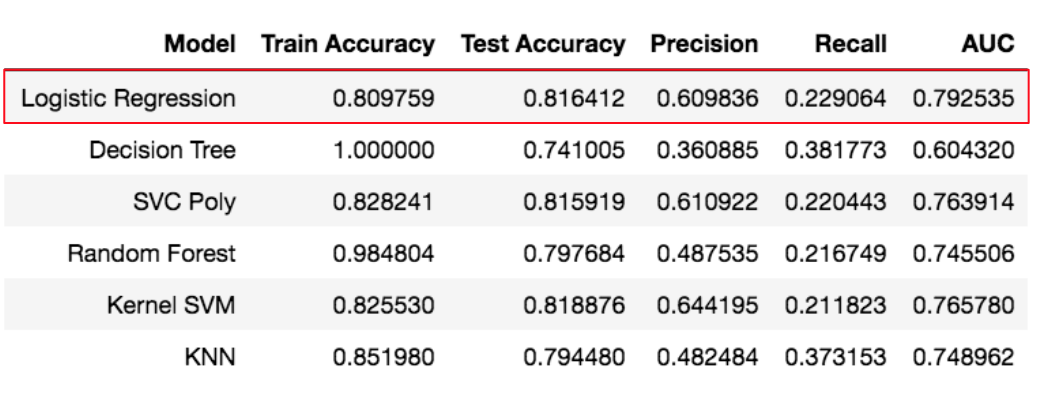
When it came to training my model, I wanted my model to have some sort of interpretability. Though the SVMs, at a glance, seemed to be good performers, they lacked the ability to tell a story. I decided on Logistic Regression as its area under the curve of my receiver operating characteristic curve was the highest versus the rest of the models. However, my recall was low, so I needed to fine-tune some hyperparameters.
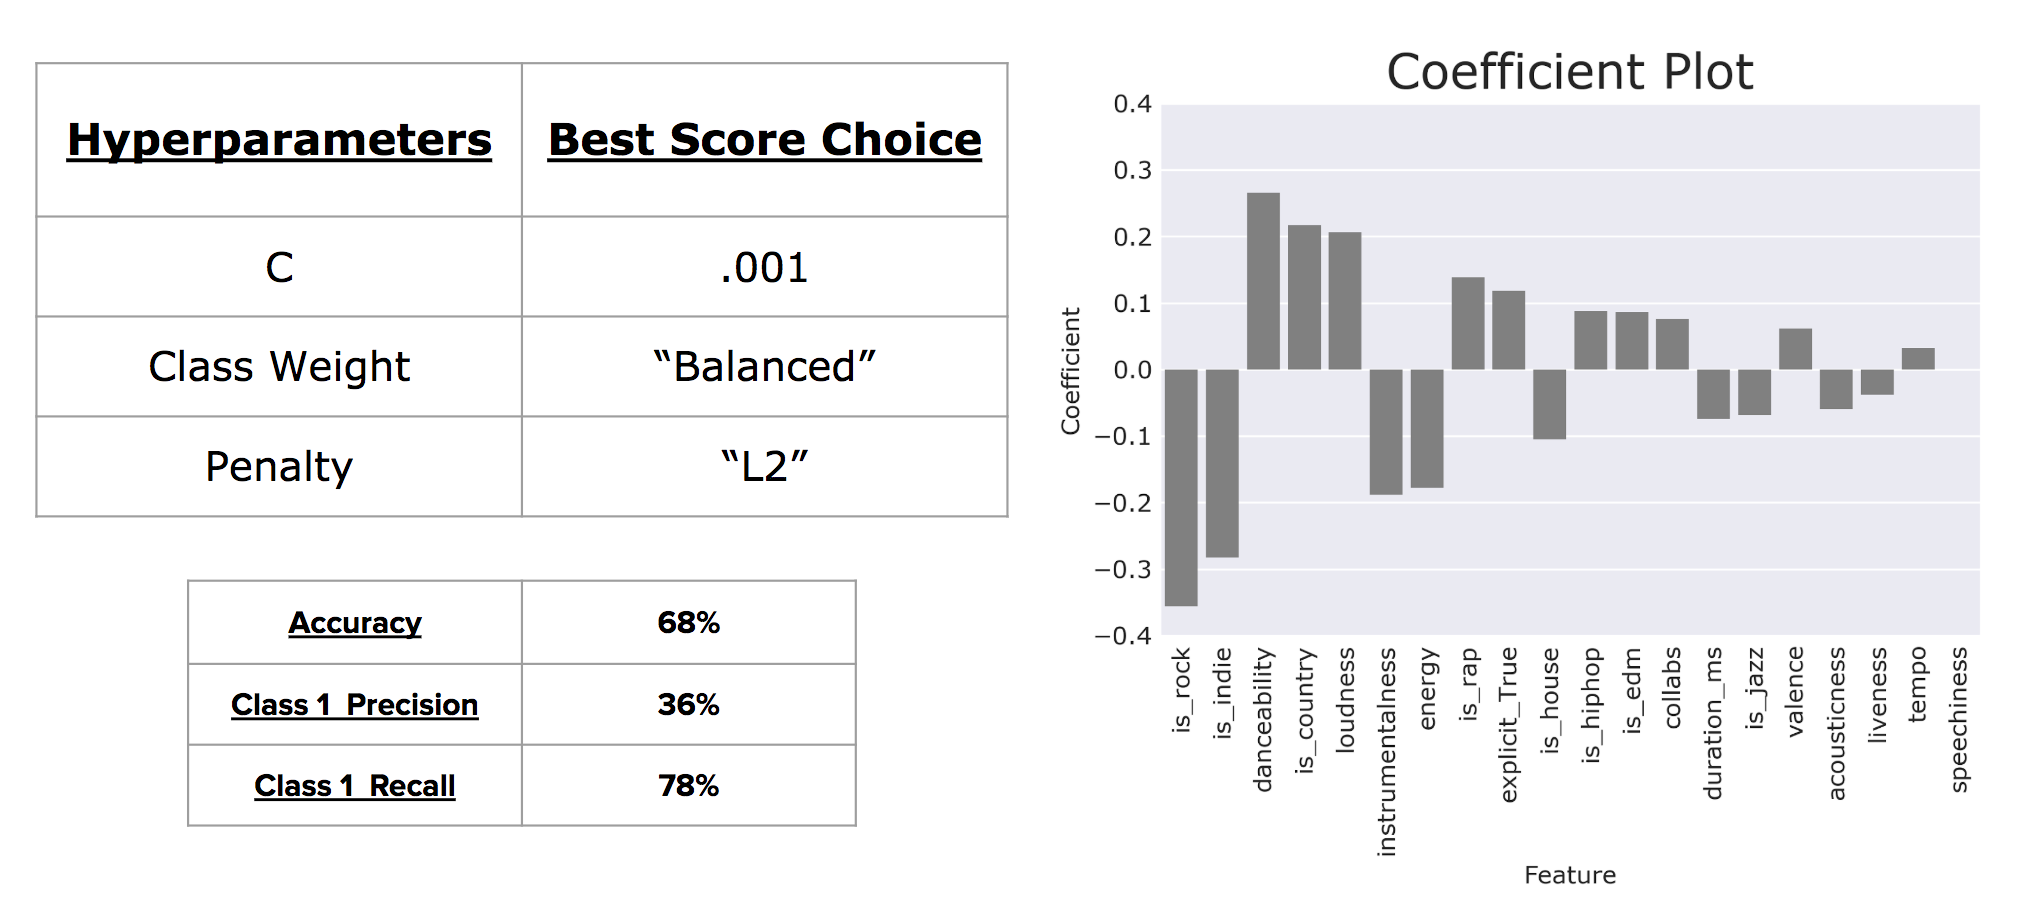
After tuning my hyperparameters to maximize recall, I was able to get my Class 1 recall percentage up to 78%. From this model, I pulled the feature coefficients and found that rock and indie artists are unlikely to appear on the Billboard Hot 100, but Country artists are more likely to appear. In addition, the more danceable or loud a song is, the more likely it is to appear on the Billboard Hot 100.
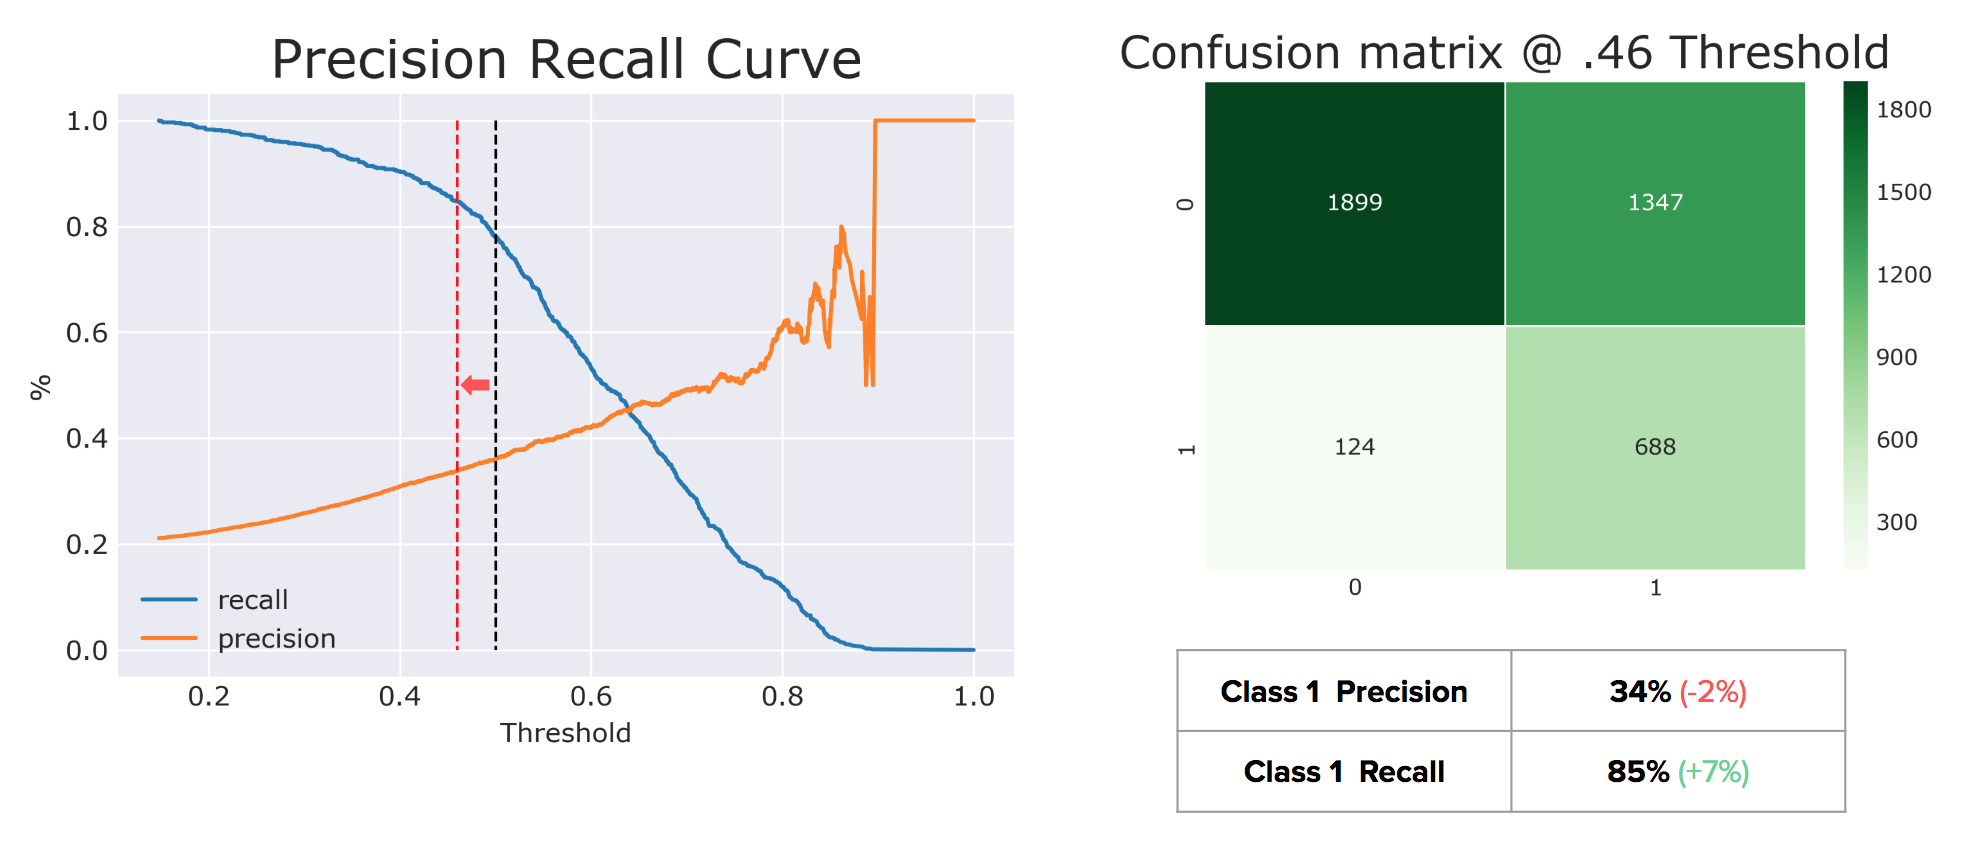
There is an inherent trade-off between precision and recall, and while the equilibrium where precision = recall exists at ~.63, I wanted to raise recall as much as possible without losing out on too much precision. By moving the threshold from .5 to .46, I was able to improve Class 1 recall by 7% and only lost 2% in precision.
Note: Post this project, I looked into weighting classes and found that by adding a weights to the classes instead of “balanced”, I could achieve an 85% recall and 35% Precision without moving the threshold.
Model examples
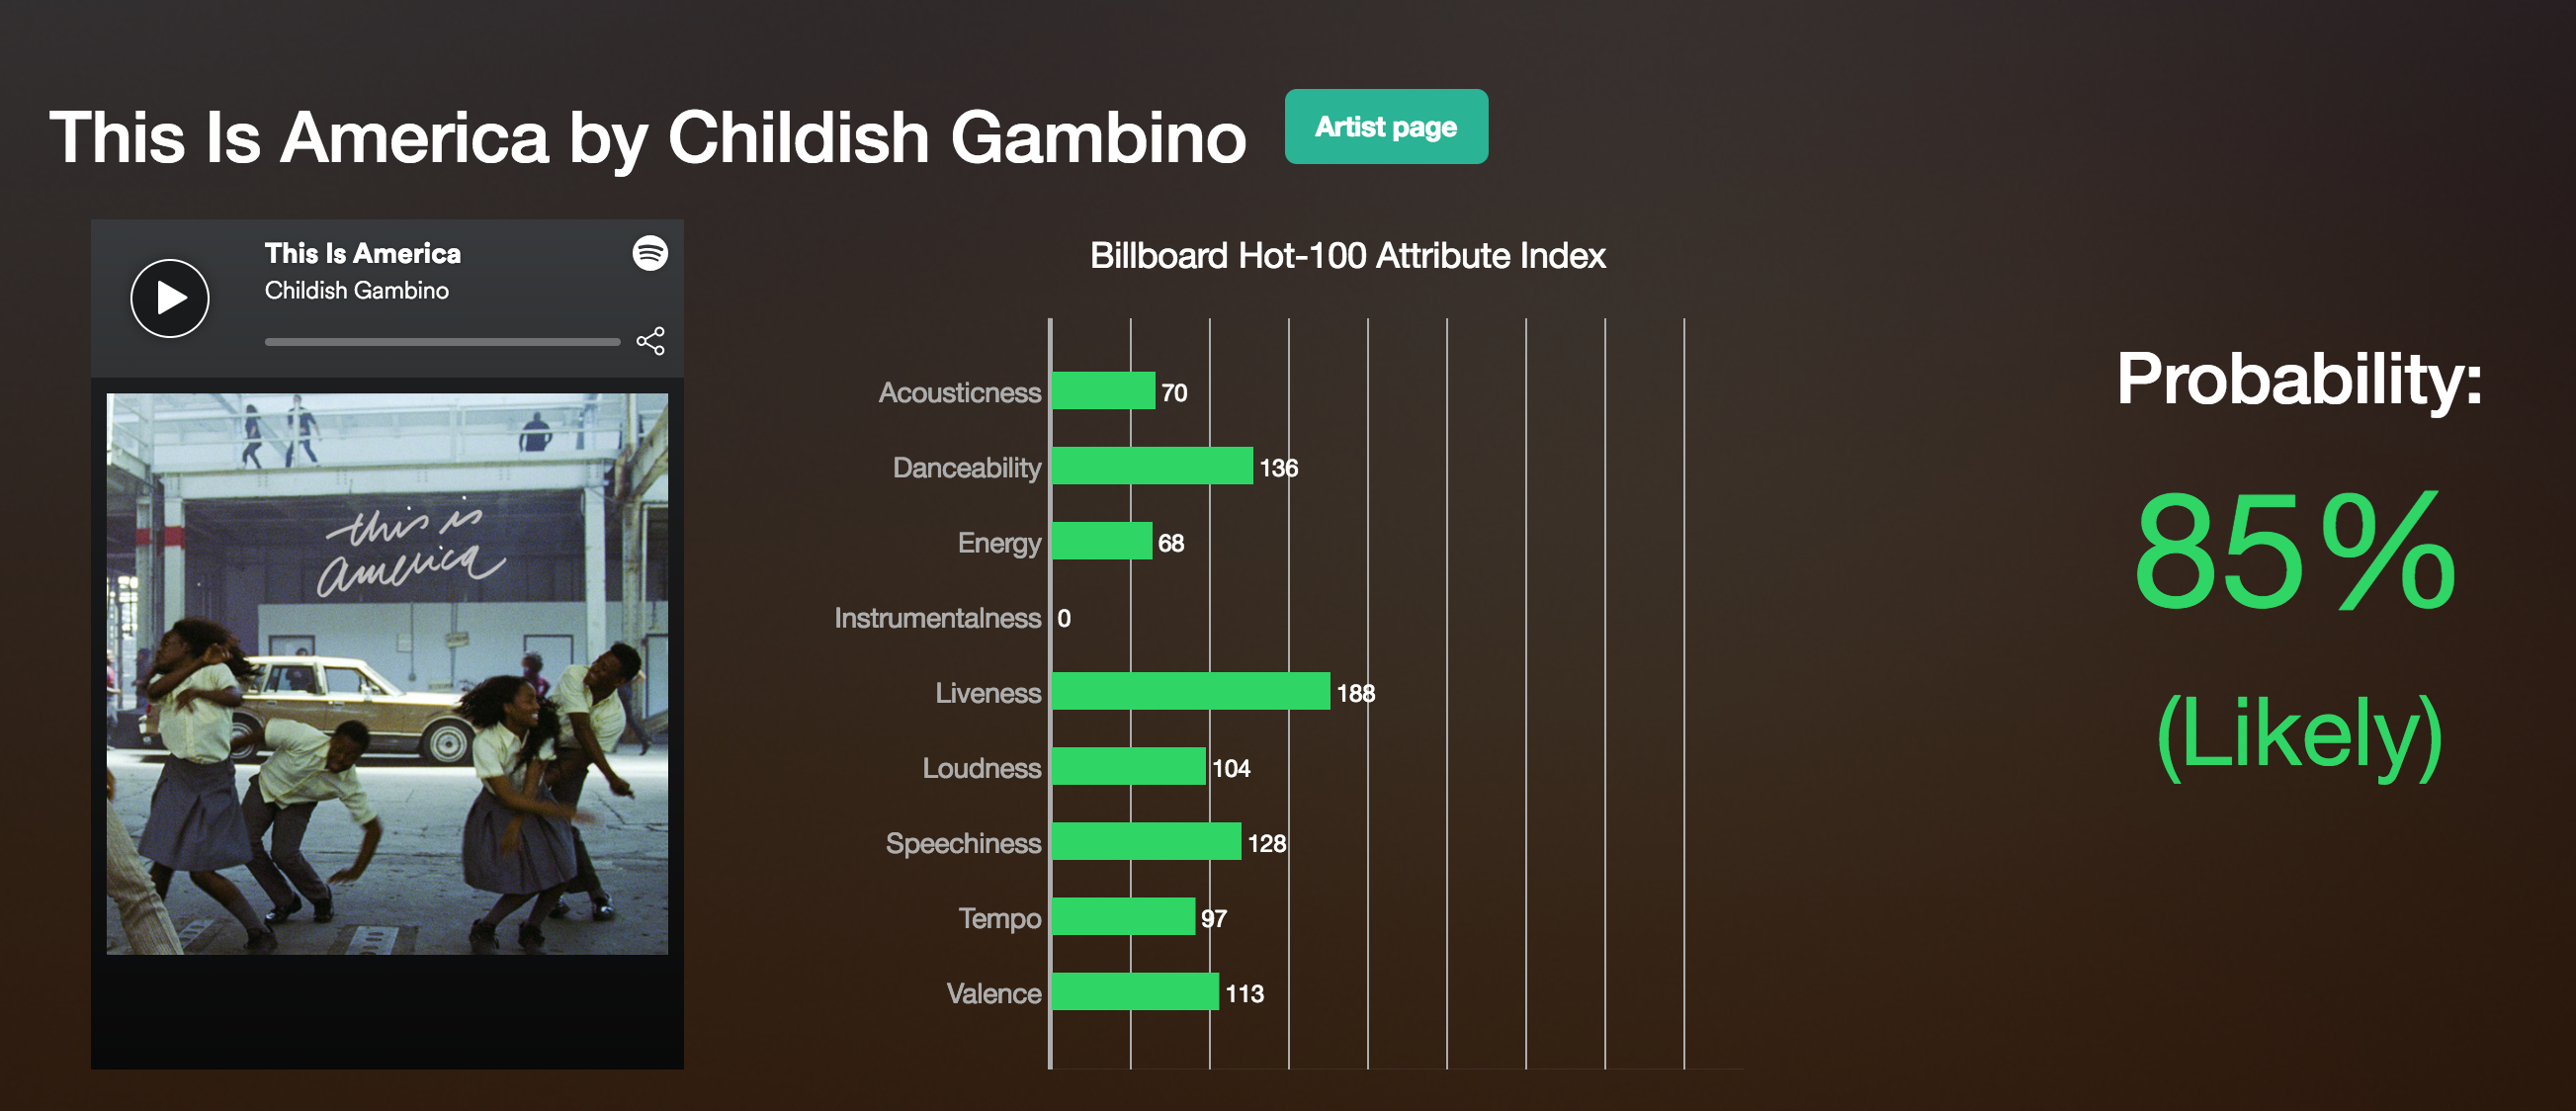
I created this project in the beginning of May, around the same time that Childish Gambino’s “This is America” came out. My model predicted that this song had an 85% probability that it would chart, and it did so on 5/14/2018 at No. 1 on the Hot-100. Not bad.
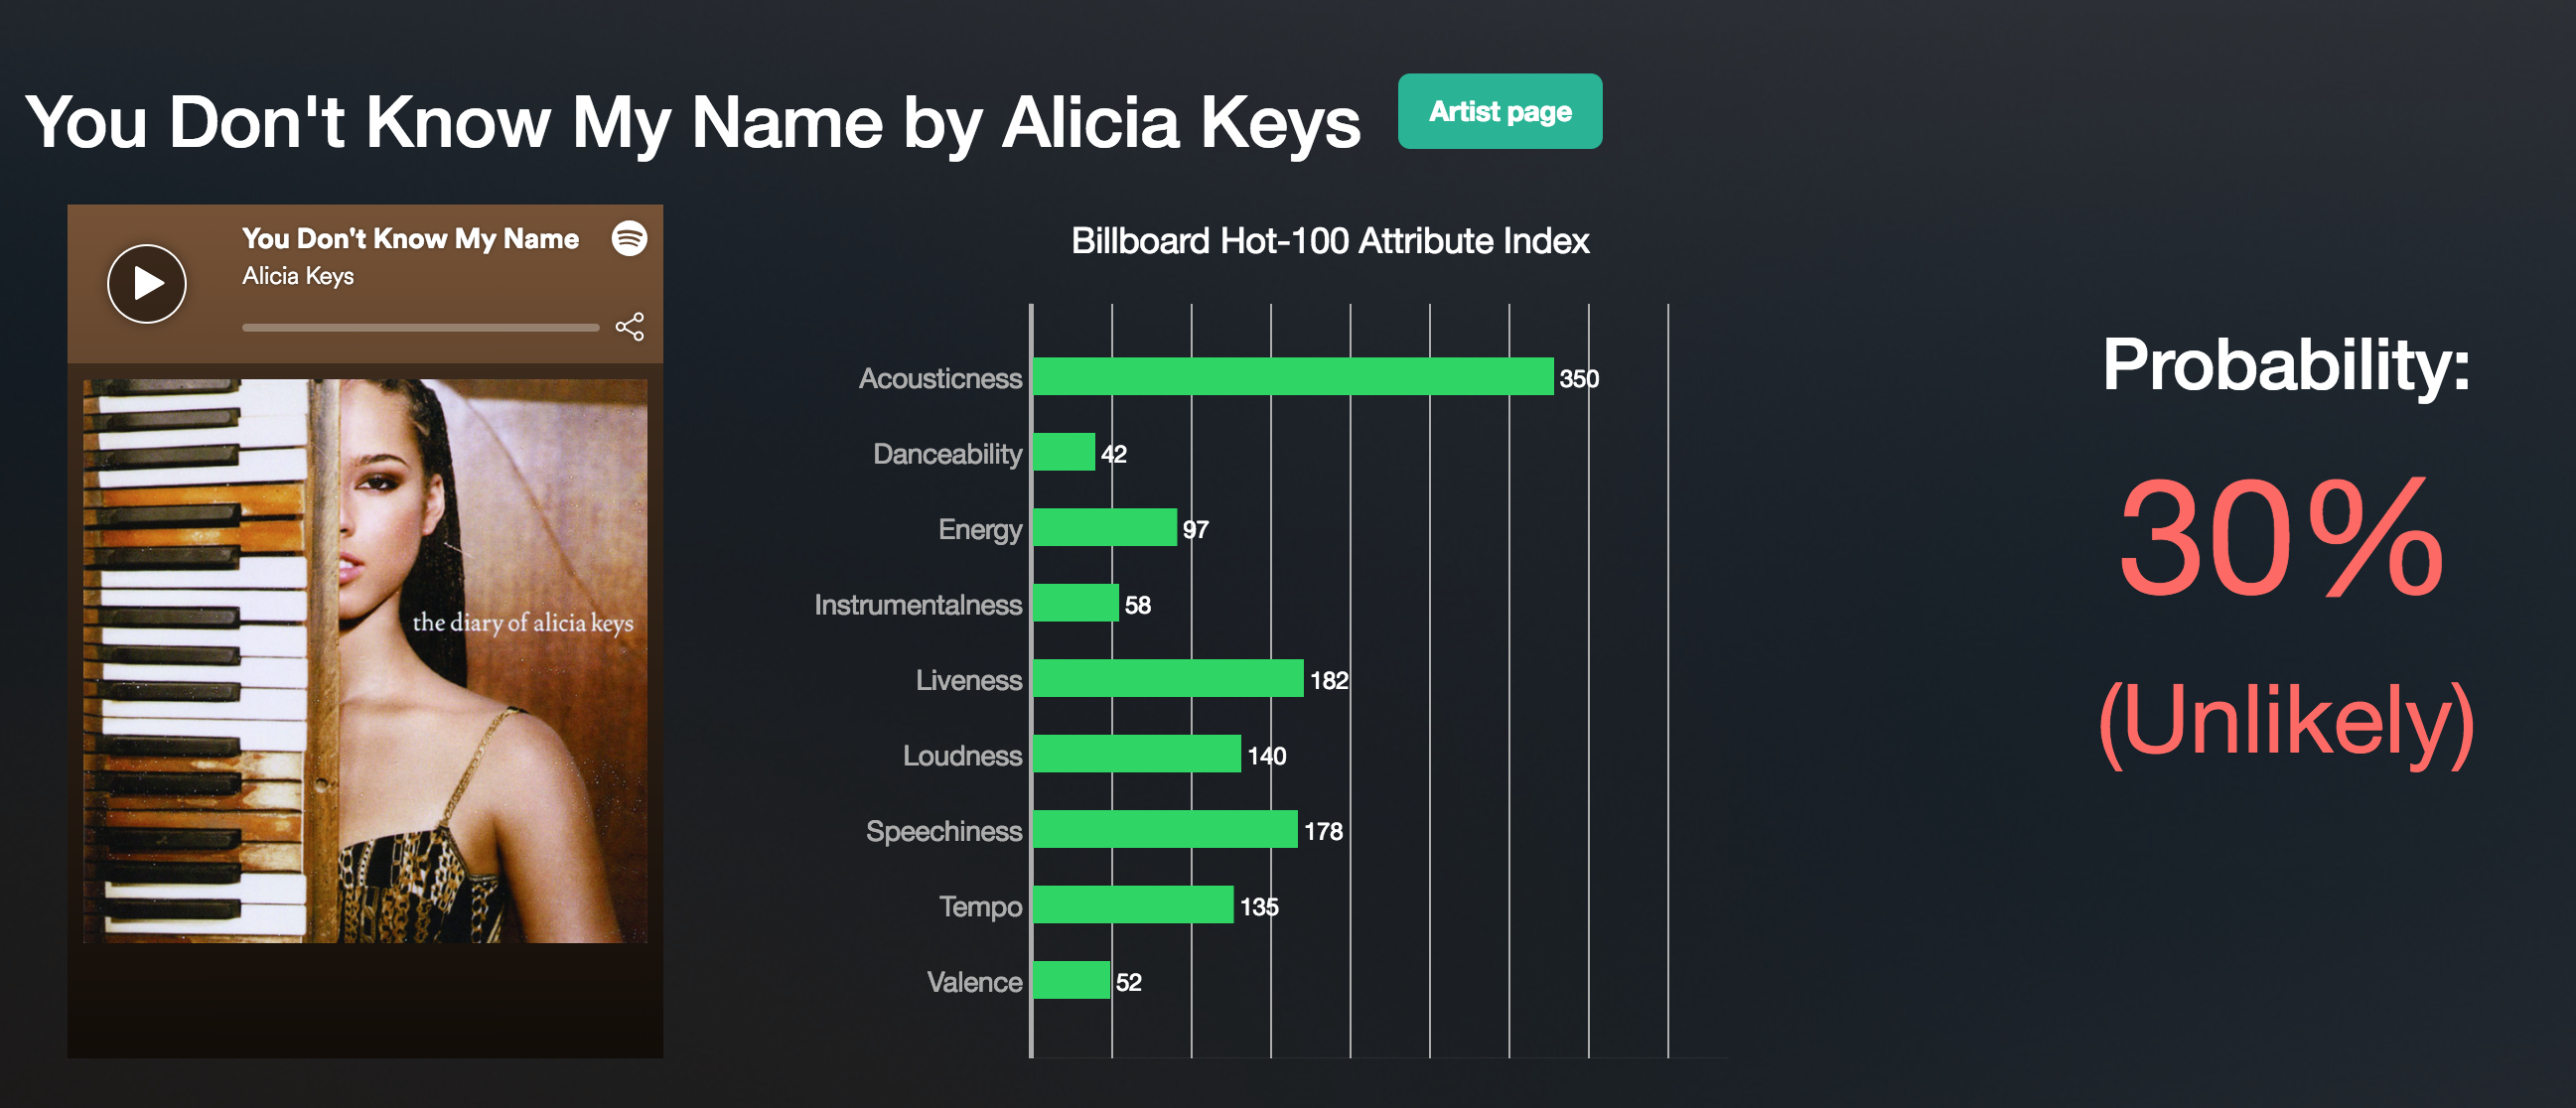
In another example, my model predicted that “You Don’t Know My Name” by Alicia Keys would not be on the Billboard Hot-100. However, the song actually peaked at #3 on the Billboard Hot 100 on 1/31/2004. How was my model so off the mark for this song? Perhaps in the early 2000’s what was “hot” was R&B songs, and those songs are not as represented in this current decade’s popular music. In the future, I would need to bring a lot more songs into the dataset and dilute the ratio of Billboard songs to all songs to represent music in general.
Thanks for reading!